
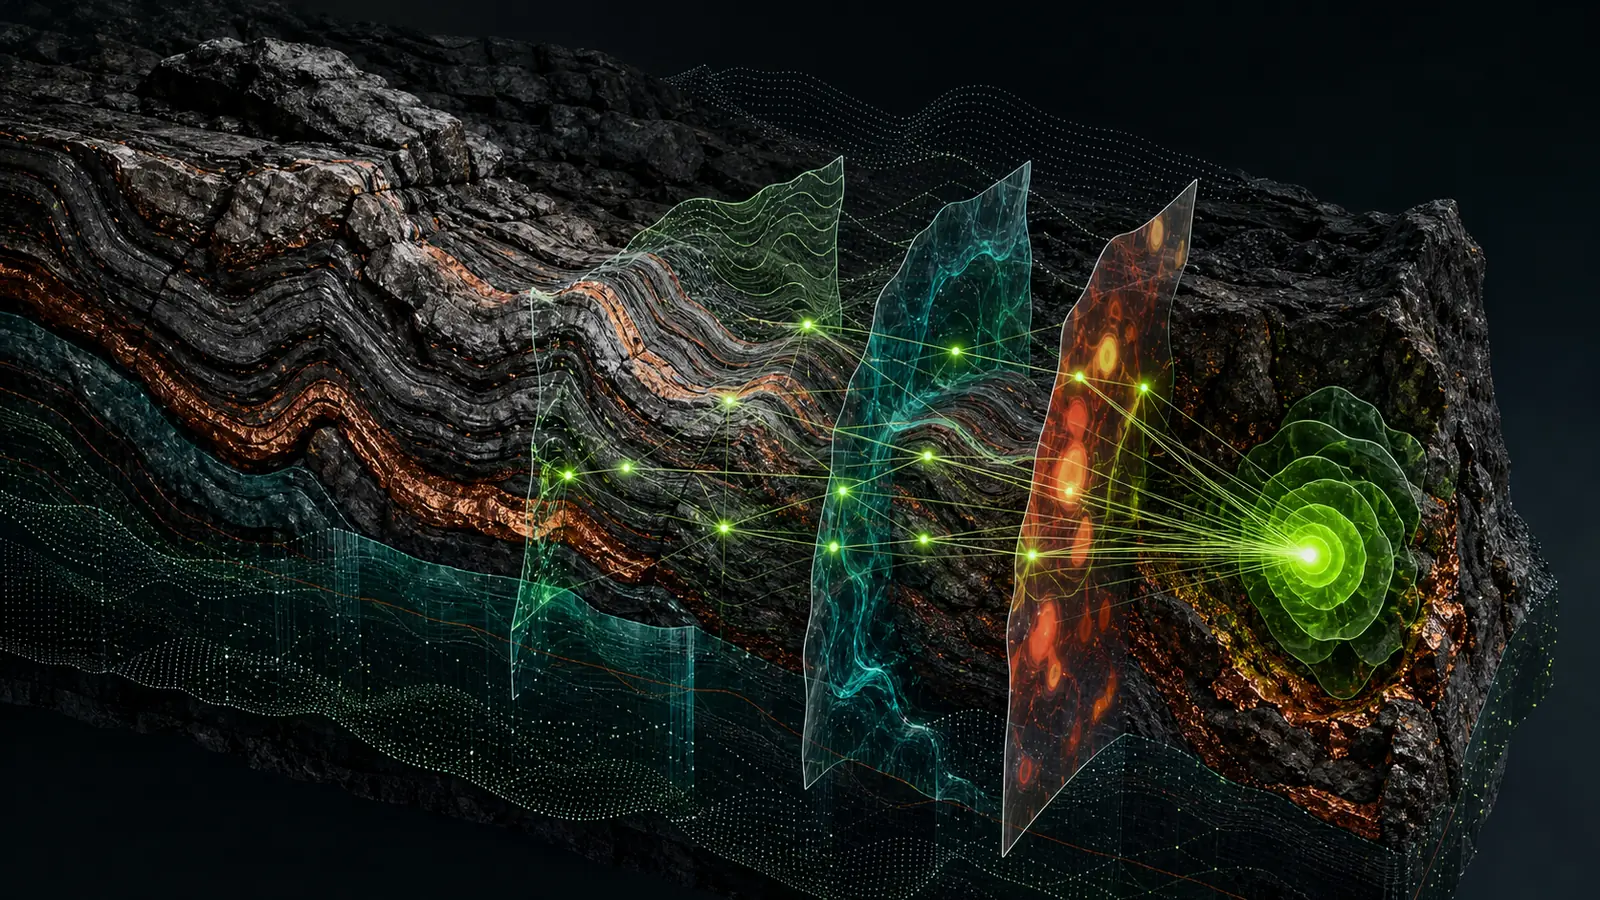
There is no universally best satellite for mineral exploration. Each instrument measures a different part of the surface response, at a particular spatial and spectral resolution, under particular acquisition constraints. A defensible study selects sensors because they contribute evidence to the deposit model—not because they are familiar or available.
ASTER: mineral and thermal context
ASTER was designed with geological and mineral-mapping applications in mind. Its original configuration included visible and near-infrared, shortwave-infrared, and thermal-infrared bands at different spatial resolutions. USGS work has used ASTER to map mineral groups and hydrothermal alteration over large areas.
An important qualification is frequently omitted: ASTER’s SWIR subsystem became unusable after April 2008. Archived scenes acquired before the failure remain important for mineral mapping, while later ASTER acquisitions should not be described as providing valid SWIR mineral information. The ASTER Level-1T product specification documents this instrument limitation.
Useful contributions
- Archived SWIR observations for selected mineral-group and alteration responses.
- Thermal-infrared information that can support lithological discrimination.
- VNIR and stereo-derived terrain context.
- Regional comparability where suitable archive coverage exists.
Watch for
- Acquisition date and SWIR validity.
- Vegetation and surface-cover interference.
- Mixed pixels at regional spatial resolution.
- Mineral-group interpretation being overstated as exact mineral identification.
Sentinel-2: current multispectral regional screening
Sentinel-2’s Multispectral Instrument samples 13 bands: four at 10 m, six at 20 m, and three at 60 m. Its visible, near-infrared, red-edge, and shortwave-infrared coverage, systematic acquisitions, and open access make it a practical base for regional screening and temporal compositing.
The official Sentinel-2 product specification provides the current band and product details.
Useful contributions
- Broad lithological and surface contrast.
- Iron-bearing and clay-related proxy responses where exposure permits.
- Vegetation, moisture, burn, snow, and water masks.
- Recent imagery for change and seasonal selection.
- Spatial detail suitable for regional target refinement.
Watch for
- Cloud and shadow contamination.
- Dense vegetation masking the substrate.
- Different native band resolutions.
- Atmospheric-correction and resampling choices.
- Index values being interpreted outside their geological context.
SAR: structure, texture, and all-weather observation
Synthetic aperture radar is an active sensor. It records microwave backscatter influenced by geometry, surface roughness, moisture, wavelength, polarization, and viewing direction. Radar can acquire data through cloud and at night, but “all weather” does not mean “easy to interpret.”
L-band systems such as ALOS PALSAR and PALSAR-2 are often used for regional terrain and structural interpretation. JAXA describes PALSAR as an active L-band microwave sensor that is not affected by cloud or daylight in the same way as optical imagery.
Useful contributions
- Structural fabric and lineament context.
- Terrain and surface-texture differences.
- Observation in persistently cloudy regions.
- Complementary geometry to optical evidence.
Watch for
- Layover, foreshortening, and radar shadow.
- Speckle and filtering choices.
- Illumination-direction bias in lineament extraction.
- Moisture and land-cover effects.
- Claims of subsurface penetration that exceed the terrain and wavelength conditions.
Elevation data: the connective layer
Digital elevation models are often the most useful common surface for joining optical and radar interpretation. They support slope, aspect, curvature, drainage, relief, terrain breaks, and lineament analysis.
DEM derivatives can be highly sensitive to resolution, resampling, hydrological conditioning, illumination, and extraction thresholds. A lineament map is an interpretation, not a fault inventory.
When multi-sensor fusion adds value
Fusion adds value when independent evidence layers answer different questions:
| Exploration question | Evidence that may help |
|---|---|
| Is there a surface alteration response? | ASTER archive, Sentinel-2, hyperspectral data |
| Is the response structurally organized? | SAR, DEM, geological mapping |
| Is it persistent across dates or products? | Multi-temporal optical composites |
| Does it align with the deposit model? | Geology, geochemistry, geophysics, occurrences |
| What can cause a false positive? | Land-cover, regolith, terrain, anthropogenic masks |
More layers do not automatically produce a better model. Every layer adds assumptions, correlation, and potential leakage. The evidence stack should remain as simple as the decision allows.
A practical selection sequence
- Define the deposit model and expected surface expression.
- Audit terrain, cover, seasonality, and archive availability.
- Select one primary dataset for each exploration question.
- Document preprocessing and data-quality exclusions.
- Test whether each layer contributes interpretable information.
- Remove redundant or unstable variables.
- Rank results with uncertainty and alternative explanations.
- Design field checks capable of falsifying the interpretation.
The goal is not to demonstrate that many sensors were used. It is to show that each selected sensor changed the quality of the exploration decision.
References
- USGS, ASTER overview.
- Copernicus, Sentinel-2 mission and data collection.
- JAXA EORC, ALOS PALSAR sensor overview.
- ESA, Sentinel data supporting geological and mineral mapping.